Authors:: Constantin Baumann, Johannes Wieczorek, Peter Spies (IIS), David Sanchez (IZM)
Wireless sensor nodes require electrical energy for their operation. To enable easy installation and use in locations without wired power supplies, this energy is typically provided by batteries. Alternatively, wireless sensors can also be powered through energy harvesting from their immediate environment.
Examples of such kinds of energy in the environment include light, temperature differences, deformations, or vibrations. Here, the size of the required energy harvesting system depends on the energy consumption of the sensor node and the amount of available ambient energy.
Determination of the carbon footprint
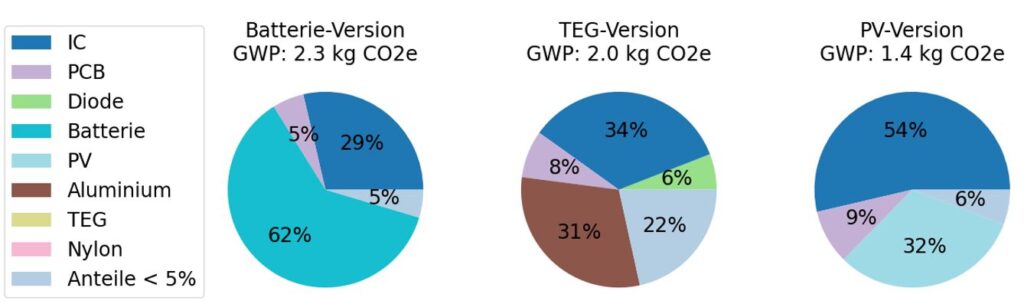
Um die verschiedenen Varianten der Sensoren und deren Energieversorgung bzgl. ihrer Nachhaltigkeit und Umweltbelastung zu bewerten, wurde der CO2To evaluate sensor nodes with various power supply options in terms of their sustainability and environmental impact, the carbon footprint arising from the production of all components will be estimated and compared for two different use cases. In the first use case, data is transmitted every 15 minutes, in the second use case every 5 minutes, which results in an average power requirement of 400 and 790 µW, respectively. This power requirement must be covered by the energy supply. In addition to a sensor node that is powered by a primary battery, another sensor node is powered by a solar cell, and the third is powered by a thermoelectric generator. An illuminance of 500 lux over 8 hours per day was assumed for the solar cell. For operation with the thermoelectric generator, a 10 K temperature difference was considered, which could exist, for example, between a warm object such as a water or heating pipe or a motor and the ambient air. During operation, these self-powered systems do not need to be supplied by the power grid, so their carbon footprint is zero during operation. The components of the various sensor nodes were grouped into categories and their share of the overall carbon footprint was shown in diagrams. Component categories whose share is less than 5% are combined.2-Fußabdruck während des Betriebs gleich null. Die Bauteile der verschiedenen Sensorknoten wurden in Kategorien zusammengefasst und deren Anteil am gesamten CO2-Fußabdruck in Diagrammen dargestellt. Bauteilkategorien, deren Anteil kleiner als 5% ist, werden zusammengefasst.
The carbon footprint values and their distribution across the different components for use case 1 are shown in Figure 1. Components with shares less than 5% include capacitors, resistors, inductors, supercapacitors, LEDs, crystals, transistors, antennas, screws, transformers, thermal interface materials (TIM), and in some cases, also diodes, nylon, and the TEG.
Break-Even Point of the lifetime in the use cases
The size and thus the carbon footprint of energy harvesting systems only depends on the ambient conditions and the energy requirement, since these, together with the size, determine the power output. However, the carbon footprint does not depend on the run time, because the power is constantly supplied from the environment. In the version with a battery, however, the carbon footprint increases with energy consumption and run time, since the size of the battery required and therefore its carbon footprint do also increase.
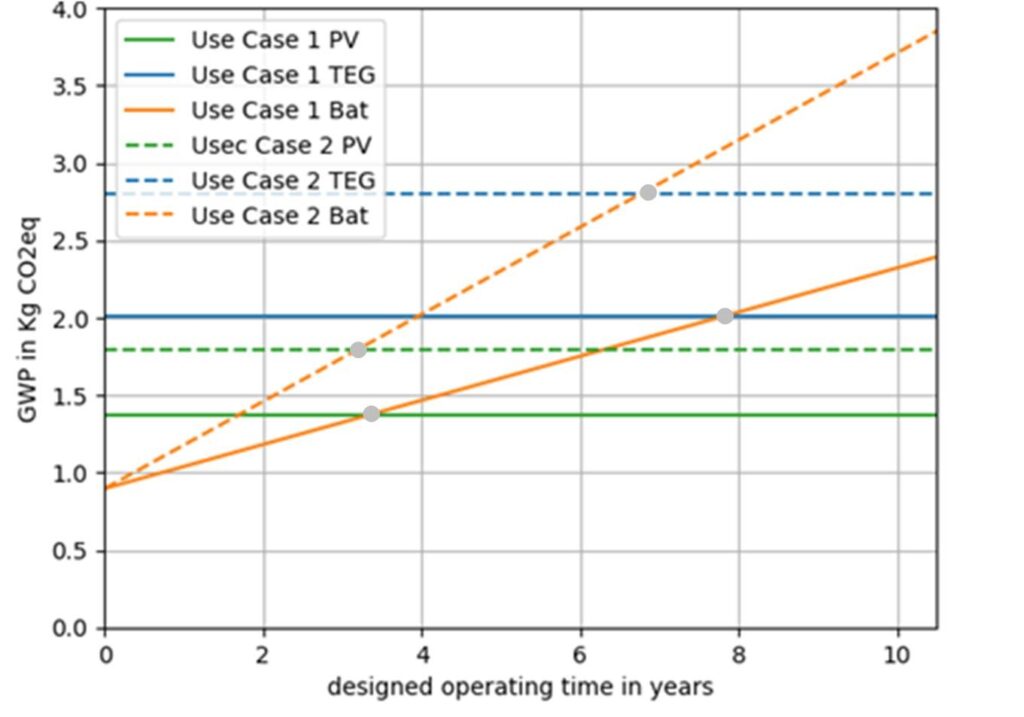
Figure 2 shows the carbon footprint of the battery solution for the two use cases as a function of the planned lifespan. At the same time, the carbon footprints of the energy harvesting solutions are plotted as constant lines, since they are independent of the planned operation time. It turns out that in the first use case, the battery-operated wireless sensor has a higher carbon footprint than the PV solution after about 3.5 years and exceeds the carbon footprint of the TEG solution after 7.5 years. The higher energy demand in the second use case causes the intersections of the carbon footprints to occur approximately half a year earlier for PV and about a year earlier for TEG. This is because, in both use cases, the PV module has a lower carbon footprint per microwatt of power than the TEG.
Summary
It is shown that in certain scenarios, there is a lower carbon footprint in the production of the energy supply when using energy harvesting compared to operation with primary batteries. For example, it is found that with a power consumption of a wireless sensor of 800 µW and a lifespan of 10 years, the carbon footprint can be reduced by 50% if a solar cell is used instead of a primary battery, provided an illuminance of 500 Lux is available for 8 hours per day. However, this carbon footprint depends on environmental conditions in the form of illuminance or temperature difference, runtime and energy requirements of the sensor node. Therefore, the intersection point at which the energy supply through energy harvesting has the same carbon footprint as supply via battery (break-even point) was examined further on.